Blog
Top Stories
Bombay Chamber’s DEI Awards 2024 Celebrates Diversity Across the Spectrum
Diversity, Equity, and Inclusion (DEI) are crucial to company culture as they foster creativity, innovation, and new perspectives. Harnessing the power of DEI requires a systematic, concerted and collaborative industry effort, to open the conversation on solutions towards closing inclusion gaps in the country. The Bombay Chamber DEI Awards 2024 celebrated organisations that have innovatively made DEI part of their corporate DNA.

The winners of the second Bombay Chamber DEI Awards were announced at a glittering ceremony at the Four Seasons Hotel Mumbai. With Deloitte as Knowledge Partner, the awards saw nominations from companies across six categories: DEI Champion Award, Award for Gender Equality Champion, LGBTQIA+ Inclusion Award, Disability Confidence and Inclusion Award, DEI Award for Best Program (Underrepresented DEI groups other than Gender, LGBTQIA+, and PwD), and a Special Award for Micro, Small, and Medium Enterprises (MSMEs). This year, the Chamber received 129 nominations, a significant increase from the 81 nominations last year. The Banking and Financial Services sector led with 25 nominations, followed by Consumer Goods, Retail, E-Commerce, and Hospitality with 23. Indian companies submitted 85 nominations, while 44 came from international companies based in India. HSBC was the Associate Partner and Dow India was the Supporting Partner.

Welcoming the gathering, Sandeep Khosla, Director General of the Bombay Chamber, spoke about the Chamber’s long and illustrious journey. Ritesh Tiwari, President of the Bombay Chamber and CFO of Hindustan Unilever Limited and Unilever South Asia, set the theme for the event, emphasising the strategic importance of DEI in all organisations. He also spoke about how DEI has been a learning journey, reflecting through the nominations in the awards, and that lessons can be learned from all the nominations.

The event featured a fireside chat on “DEI as a Strategic Business Lever” with Nisaba Godrej, Executive Chairperson of Godrej Consumer Products Ltd., and Meenakshi Priyam, Chairperson of the Diversity & Inclusion Committee at the Bombay Chamber and Group CHRO at udaan. Godrej emphasised, “Leadership is a privilege where you should not just deliver numbers and service customers, but you need to serve your organisation as well. Fulfillment and meaning come from serving others.” She highlighted the importance of representation and shared stories illustrating this need, advocating for capable, passionate, and empathetic leadership, supported by Godrej’s detailed DEI scorecard as evidence of their commitment.

The evening also saw a panel discussion on “DEI in Corporate India: The Roadmap,” moderated by Nitin Razdan, Partner, Human Capital at Deloitte South Asia. The panel included Neera Saggi, the first woman President (2013-14) of the Bombay Chamber; Parimala Bhat, Founder & Chairperson of Snehankit Helpline; and Parmesh Shahani, Head of the Godrej DEI Lab. Shahani emphasised the importance of converting DEI intentions into actions through structural changes and continuous inclusivity efforts beyond token celebrations. Bhat discussed the severe challenges faced by marginalised communities in accessing healthcare, education, and employment, proposing practical solutions like mobile clinics, telemedicine, and corporate partnerships with hospitals, and advocating for societal awareness and support for people with disabilities. Saggi examined the progress of DEI in boardrooms, noting some advancements but emphasising the need for continuous assessment and psychologically safe workplaces. She called for corporate support systems and top leadership to champion diversity policies. Razdan explored the potential of AI in aiding marginalised groups, suggesting technology’s pivotal role in advancing DEI.

The second fireside chat on “Jury Reflection – Evolving DEI Journey in Corporate India” featured Puneet Chhatwal, Managing Director & CEO of The Indian Hotels Company Ltd., and Priyam. Chhatwal spoke about the jury’s decision-making process and the challenges faced by 24/7 businesses such as hotels in ensuring a diverse workforce.
The winners of the Bombay Chamber DEI 2024 Awards were:
Special Award for MSMEs
Winner: Shashi Natural and Organics Pvt Ltd
1st Runner-up: NICHEM Solutions.
2nd Runner-up: Juris Corp
DEI Champion Award
Winner: InterGlobe Aviation Limited (IndiGo)
1st Runner-up: Godrej Properties Limited
2nd Runner-up: Shell India Markets Private Limited
2nd Runner-up: Capgemini Technology Services India Limited
Gender Equality Champion Award
Winner: Capgemini Technology Services India Limited
1st Runner-up: Federal Bank
2nd Runner-up: Khaitan & Co.
LGBTQIA+ Inclusion Award
Winner: Godrej Properties Limited
1st Runner-up: Deutsche Bank Group
1st Runner-up: Shell India Markets Private Limited
2nd Runner-up: Khaitan & Co.
Disability Confidence and Inclusion Award
Winner: LTIMindtree Limited
1st Runner-up: Shell India Markets Private Limited
2nd Runner-up: Capgemini Technology Services India Limited
Best DEI Program Award
Winner: Standard Chartered Bank, India
1st Runner-up: Tata Communications Ltd
2nd Runner-up: TVS Motor Company
Bombay Chamber’s Landmark Conclave on SM REITs: Ownership to Opportunity Focuses on Fostering Economic Growth & Investor Confidence
Bombay Chamber’s Landmark Conclave on SM REITs: Ownership to Opportunity Focuses on Fostering Economic Growth & Investor Confidence
India’s real estate sector is undergoing a revolutionary transformation driven by proactive regulatory reforms. These changes are enhancing accessibility, transparency, and stability for investors. Landmark initiatives include the RERA Act of 2016, which boosts developer responsibility, and the introduction of GST, which streamlines taxation. The advent of Real Estate Investment Trusts (REITs) regulations in 2014 has also established a new asset class, with the first Indian REIT listed in 2019, offering retail investors a gateway into institutional real estate.
The latest regulatory advancement by SEBI, the introduction of Small and Medium Enterprises REITs (SM REITs), is set to democratise real estate investment further. This new framework lowers entry barriers and enhances regulatory oversight, providing benefits such as liquidity and investor protection mechanisms. The move is expected to bring the real estate market into the sachet economy, making high-quality real estate investments accessible to a broader audience.
It is with this background that the Bombay Chamber of Commerce and Industry hosted the Conclave on SM REITs: Ownership to Opportunity, a pioneering event addressing the recent regulatory advancements in the real estate sector. This conclave, held under the aegis of the PE&VC Committee, highlighted the transformative potential of Small and Medium Real Estate Investment Trusts (SM REITs), newly regulated by SEBI as of March 8, 2024.

In her welcome address, Pinky Mehta, President Designate of the Bombay Chamber and Director at Aditya Birla Sun Life Insurance, emphasised SEBI’s framework as a game changer. She highlighted the opportunity for investors to own fractions of rent-yielding real estate assets with a minimum investment of Rs 10 lakh. This move supports asset monetisation for developers and fosters growth in the sector.

Ashith Kampani, Chair of the PE&VC Committee and Chairman of CosmicMandala Group of Companies, spoke on SEBI’s regulations for SM REITs democratising access to real estate investments. He highlighted the expected tenfold growth in the fractional ownership market, projecting assets under management to reach $5 billion by 2030.Kampani noted that SEBI’s new regulations not only democratise access but also standardise investment practices, fostering a more inclusive and dynamic real estate market.
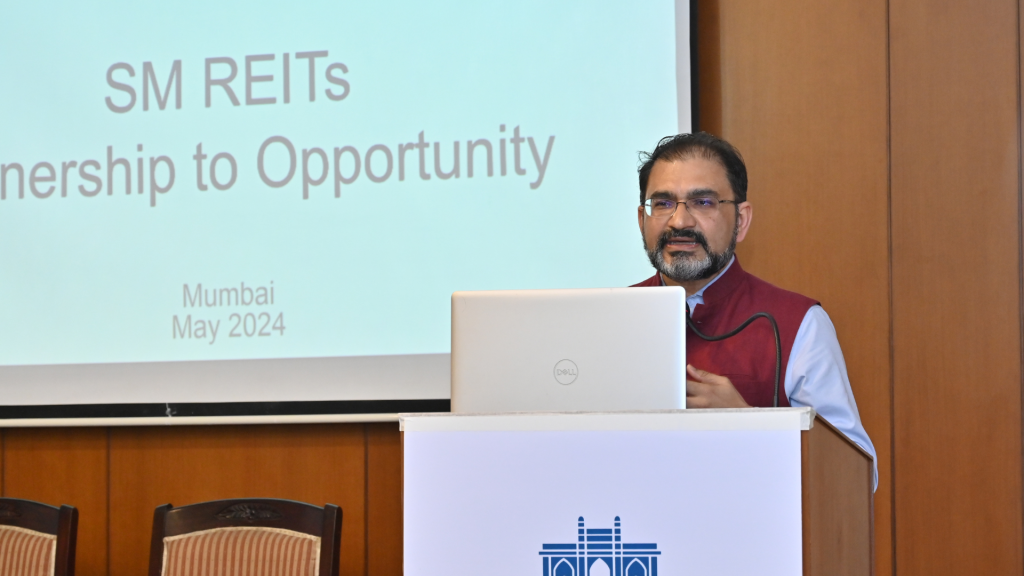
Delivering the keynote address, Shri Pramod Rao, Executive Director of SEBI, provided a compelling narrative on the historical context and transformative potential of SM REIT regulations. Rao recounted SEBI’s journey from banning unregistered Collective Investment Schemes in the 1990s to the establishment of SM REIT regulations in 2024, marking a significant milestone in regulatory evolution. He delved into the intricacies of the SM REITs regulations, sharing his expertise and painting a vivid picture of their transformative potential for the real estate sector and the broader economic landscape.
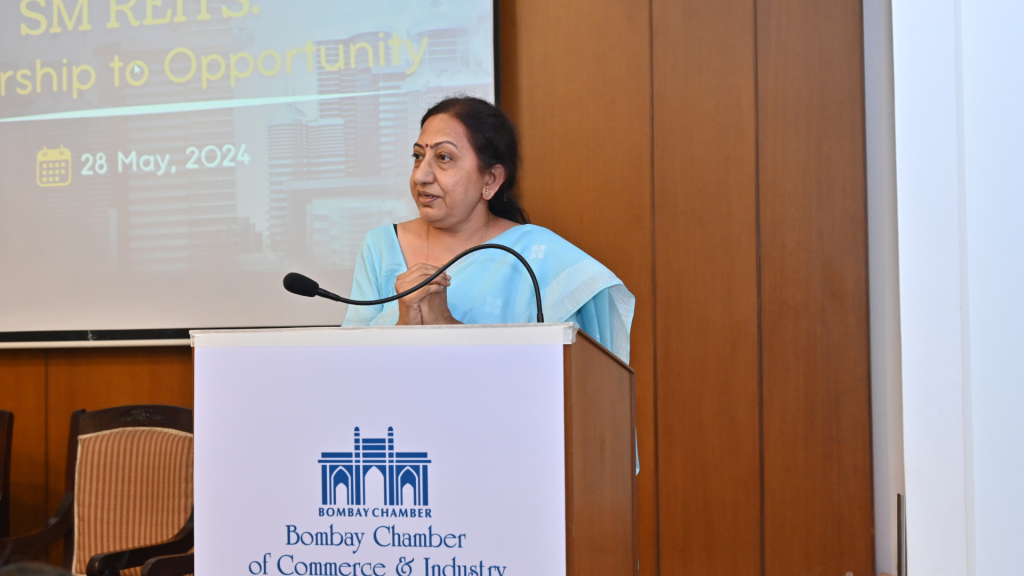
Sushri Kamala K, Chief Regulatory Officer of BSE, emphasised the importance of popularising SM REITs and leveraging existing distribution channels for rapid rollout. She reflected on the transformation of exchanges into transparent, governed entities and advocated for a strategic approach to maximise growth potential. Kamala highlighted how exchanges have evolved over the past 30 years, becoming listed entities governed by high standards of transparency and governance.

The conclave featured two engaging panel discussions, providing a comprehensive view of the regulatory and market dynamics surrounding SM REITs. The first panel, moderated by Gaurav Karnik, Head of Real Estate Tax Practice at EY, focused on the regulatory aspects of SM REITs. Panelists included Shiv Parekh, Founder and CEO of hBits, Sudarshan Lodha, Co-Founder of Strata, Sandeep Parekh, Managing Partner at Finsec Law Advisors, and Nikhil Agrawal, Chief of Staff at WiseX. They offered insights into compliance requirements and investor protection mechanisms.

The second panel discussion, moderated by Neil Borate, Deputy Editor at LiveMint, explored the market opportunities and competitive landscape of SM REITs. Panelists Manish Kumar, Co-Founder and CEO of RealX & GREX, and Member, PE&VC Committee, Bombay Chamber of Commerce, Rahul Rai, Head of Real Estate Investment Business at ICICI Prudential AMC Ltd, Varun Gupta, CEO of Groww Mutual Fund, and Monang Doshi, Senior Director, Capital Markets & Land, CBRE India, discussed future trends and growth prospects in real estate investment.
Maiden India Pavilion at World Hydrogen Summit 2024, Netherlands showcases National Green Hydrogen Mission
Maiden India Pavilion at World Hydrogen Summit 2024, Netherlands showcases National Green Hydrogen Mission
For the first time, India has set up its own pavilion, at the World Hydrogen Summit 2024, being held in Rotterdam, Netherlands, during May 13 – 15, 2024. The India Pavilion, set up by the Ministry of New & Renewable Energy, Government of India, is one of the largest pavilions at the Summit and has been inaugurated by Secretary, Ministry of New and Renewable Energy, Shri Bhupinder S. Bhalla on May 12, 2024

The World Hydrogen Summit is a prestigious event in the global green hydrogen ecosystem. Around 15,000 delegates from around the world are expected to attend the Summit. The India Pavilion at the conference provides India an opportunity to showcase to the world the progress made by the country in the field of Green Hydrogen.

The Indian delegation comprises nominees from Ministry of New & Renewable Energy, Department of Science and Technology, Ministry of Railways, Ministry of Petroleum and Natural Gas and from private sector companies as well. In addition to various G2G interactions, the Summit provides a platform for Indian industry to engage with companies from around the globe.

India launched its National Green Hydrogen Mission in January 2023 with an overall outlay of Rs. 19,744 crores. India has set an ambitious target to achieve a green hydrogen production capacity of 5 MMT (Million Metric Tonnes) by end of the year 2030. As on date, the Ministry of New & Renewable Energy has awarded tenders for setting up of 412,000 tonnes of Green Hydrogen production capacity and 1,500 MW of electrolyzer manufacturing capacity.
India has also notified scheme guidelines for use of Green Hydrogen in steel, transport / mobility and shipping sectors. The Department of Science and Technology has initiated Hydrogen Valley Innovation Clusters to foster innovation and promote Green Hydrogen ecosystem in India.
A dedicated portal for the National Green Hydrogen Mission has been launched recently, to serve as a one-stop location for information on the Mission and steps taken for the development of the green hydrogen ecosystem in India. The portal can be accessed here: https://nghm.mnre.gov.in/.
Combined Index of Eight Core Industries (ICI) increases by 5.2 per cent
Combined Index of Eight Core Industries (ICI) increases by 5.2 per cent

The combined Index of Eight Core Industries (ICI) increased by 5.2 per cent (provisional) in March, 2024 as compared to the Index in March, 2023. The production of Cement, Coal, Electricity, Natural Gas, Steel and Crude Oil recorded positive growth in March 2024. The details of annual and monthly indices and growth rates are provided at Annex I and Annex II respectively.
The ICI measures the combined and individual performance of production of eight core industries viz. Cement, Coal, Crude Oil, Electricity, Fertilizers, Natural Gas, Refinery Products and Steel. The Eight Core Industries comprise 40.27 percent of the weight of items included in the Index of Industrial Production (IIP).
The final growth rate of Index of Eight Core Industries for December 2023 is revised to 5.0per cent. The cumulative growth rate of ICI during 2023-24 reported 7.5 per cent (provisional) as compared to the corresponding period of last year.
The summary of the Index of Eight Core Industries is given below:
Cement – Cement production (weight: 5.37 per cent) increased by 10.6 per cent in March, 2024 over March, 2023. Its cumulative index increased by 9.1 per cent during 2023-24 over corresponding period of the previous year.
Coal – Coal production (weight: 10.33 per cent) increased by 8.7 per cent in March, 2024 over March, 2023. Its cumulative index increased by 11.7 per cent during 2023-24 over corresponding period of the previous year.
Crude Oil – Crude Oil production (weight: 8.98 per cent) increased by 2.0 per cent in March, 2024 over March, 2023. Its cumulative index increased by 0.6 per cent during 2023-24 over corresponding period of the previous year.
Electricity – Electricity generation (weight: 19.85 per cent) increased by 8.0 per cent in March, 2024 over March, 2023. Its cumulative index increased by 7.0 per cent during 2023-24 over corresponding period of the previous year.
Fertilizers – Fertilizer production (weight: 2.63 per cent) declined by 1.3 per cent in March 2024 over March, 2023. Its cumulative index increased by 3.7 per cent during 2023-24 over corresponding period of the previous year.
Natural Gas – Natural Gas production (weight: 6.88 per cent) increased by 6.3 per cent in March, 2024 over March, 2023. Its cumulative index increased by 6.1 per cent during 2023-24 over corresponding period of the previous year.
Petroleum Refinery Products – Petroleum Refinery production (weight: 28.04 per cent) declined by 0.3 per cent in March, 2024 over March, 2023. Its cumulative index increased by 3.4 per cent during 2023-24 over corresponding period of the previous year.
Steel – Steel production (weight: 17.92 per cent) increased by 5.5 per cent in March, 2024 over March, 2023. Its cumulative index increased by 12.3 per cent during 2023-24 over corresponding period of the previous year.
Note 1: Data for January, 2024, February, 2024 and March, 2024are provisional. Index numbers of Core Industries are revised/finalized as per updated data from source agencies.
Note 2: Since April 2014, Electricity generation data from Renewable sources are also included.
Note 3: The industry-wise weights indicated above are individual industry weights derived from IIP and blown up on pro rata basis to a combined weight of ICI equal to 100.
Note 4: Since March 2019, a new steel product called Hot Rolled Pickled and Oiled (HRPO) under the item ‘Cold Rolled (CR) coils’ within the production of finished steel has also been included.
Note 5: Release of the index for April, 2024 will be on Friday31st May, 2024.
Annex I
Performance of Eight Core Industries
Yearly Index & Growth Rate
Base Year: 2011-12=100
Index
| Sector | Coal | Crude Oil | Natural Gas | Refinery Products | Fertilizers | Steel | Cement | Electricity | Overall Index |
| Weight | 10.33 | 8.98 | 6.88 | 28.04 | 2.63 | 17.92 | 5.37 | 19.85 | 100.00 |
| 2012-13 | 103.2 | 99.4 | 85.6 | 107.2 | 96.7 | 107.9 | 107.5 | 104.0 | 103.8 |
| 2013-14 | 104.2 | 99.2 | 74.5 | 108.6 | 98.1 | 115.8 | 111.5 | 110.3 | 106.5 |
| 2014-15 | 112.6 | 98.4 | 70.5 | 108.8 | 99.4 | 121.7 | 118.1 | 126.6 | 111.7 |
| 2015-16 | 118.0 | 97.0 | 67.2 | 114.1 | 106.4 | 120.2 | 123.5 | 133.8 | 115.1 |
| 2016-17 | 121.8 | 94.5 | 66.5 | 119.7 | 106.6 | 133.1 | 122.0 | 141.6 | 120.5 |
| 2017-18 | 124.9 | 93.7 | 68.4 | 125.2 | 106.6 | 140.5 | 129.7 | 149.2 | 125.7 |
| 2018-19 | 134.1 | 89.8 | 69.0 | 129.1 | 107.0 | 147.7 | 147.0 | 156.9 | 131.2 |
| 2019-20 | 133.6 | 84.5 | 65.1 | 129.4 | 109.8 | 152.6 | 145.7 | 158.4 | 131.6 |
| 2020-21 | 131.1 | 80.1 | 59.8 | 114.9 | 111.6 | 139.4 | 130.0 | 157.6 | 123.2 |
| 2021-22 | 142.3 | 77.9 | 71.3 | 125.1 | 112.4 | 163.0 | 156.9 | 170.1 | 136.1 |
| 2022-23 | 163.5 | 76.6 | 72.4 | 131.2 | 125.1 | 178.1 | 170.6 | 185.2 | 146.7 |
| 2023-24* | 182.6 | 77.1 | 76.8 | 135.6 | 129.8 | 200.0 | 186.2 | 198.2 | 157.7 |
*Provisional
Growth Rates (on Y-o-Y basis in per cent)
| Sector | Coal | Crude Oil | Natural Gas | Refinery Products | Fertilizers | Steel | Cement | Electricity | Overall Growth |
| Weight | 10.33 | 8.98 | 6.88 | 28.04 | 2.63 | 17.92 | 5.37 | 19.85 | 100.00 |
| 2012-13 | 3.2 | -0.6 | -14.4 | 7.2 | -3.3 | 7.9 | 7.5 | 4.0 | 3.8 |
| 2013-14 | 1.0 | -0.2 | -12.9 | 1.4 | 1.5 | 7.3 | 3.7 | 6.1 | 2.6 |
| 2014-15 | 8.0 | -0.9 | -5.3 | 0.2 | 1.3 | 5.1 | 5.9 | 14.8 | 4.9 |
| 2015-16 | 4.8 | -1.4 | -4.7 | 4.9 | 7.0 | -1.3 | 4.6 | 5.7 | 3.0 |
| 2016-17 | 3.2 | -2.5 | -1.0 | 4.9 | 0.2 | 10.7 | -1.2 | 5.8 | 4.8 |
| 2017-18 | 2.6 | -0.9 | 2.9 | 4.6 | 0.03 | 5.6 | 6.3 | 5.3 | 4.3 |
| 2018-19 | 7.4 | -4.1 | 0.8 | 3.1 | 0.3 | 5.1 | 13.3 | 5.2 | 4.4 |
| 2019-20 | -0.4 | -5.9 | -5.6 | 0.2 | 2.7 | 3.4 | -0.9 | 0.9 | 0.4 |
| 2020-21 | -1.9 | -5.2 | -8.2 | -11.2 | 1.7 | -8.7 | -10.8 | -0.5 | -6.4 |
| 2021-22 | 8.5 | -2.6 | 19.2 | 8.9 | 0.7 | 16.9 | 20.8 | 8.0 | 10.4 |
| 2022-23 | 14.8 | -1.7 | 1.6 | 4.8 | 11.3 | 9.3 | 8.7 | 8.9 | 7.8 |
| 2023-24* | 11.7 | 0.6 | 6.1 | 3.4 | 3.7 | 12.3 | 9.1 | 7.0 | 7.5 |
*Provisional.
Y-o-Y is calculated over the corresponding financial year of previous year
Annex II
Performance of Eight Core Industries
Monthly Index & Growth Rate
Base Year: 2011-12=100
Index
| Sector | Coal | Crude Oil | Natural Gas | Refinery Products | Fertilizers | Steel | Cement | Electricity | Overall Index |
| Weight | 10.33 | 8.98 | 6.88 | 28.04 | 2.63 | 17.92 | 5.37 | 19.85 | 100.00 |
| Mar-23 | 235.5 | 77.3 | 74.6 | 144.7 | 118.1 | 204.4 | 198.4 | 188.0 | 164.7 |
| Apr-23 | 161.2 | 75.0 | 68.9 | 132.7 | 118.7 | 191.2 | 192.0 | 192.3 | 151.2 |
| May-23 | 167.6 | 78.8 | 73.2 | 141.1 | 138.2 | 192.5 | 191.8 | 201.6 | 157.4 |
| Jun-23 | 162.4 | 76.4 | 73.4 | 136.2 | 130.8 | 191.9 | 195.0 | 205.2 | 155.9 |
| Jul-23 | 152.6 | 78.9 | 79.0 | 134.4 | 131.8 | 191.7 | 166.1 | 204.0 | 153.2 |
| Aug-23 | 150.3 | 78.4 | 80.3 | 135.4 | 133.3 | 198.4 | 182.0 | 220.5 | 158.6 |
| Sep-23 | 147.9 | 74.9 | 76.8 | 126.8 | 132.3 | 198.4 | 166.2 | 205.9 | 151.7 |
| Oct-23 | 172.6 | 78.4 | 80.3 | 128.8 | 136.4 | 201.4 | 181.5 | 203.8 | 156.4 |
| Nov-23 | 185.7 | 75.5 | 77.2 | 134.5 | 133.5 | 192.6 | 156.5 | 176.3 | 150.4 |
| Dec-23 | 204.3 | 77.4 | 79.5 | 145.0 | 137.5 | 206.7 | 191.9 | 181.6 | 161.2 |
| Jan-24* | 218.9 | 78.8 | 79.3 | 135.8 | 135.0 | 216.8 | 195.1 | 197.1 | 165.3 |
| Feb-24* | 212.1 | 73.5 | 74.5 | 132.5 | 113.3 | 202.2 | 196.5 | 187.1 | 157.7 |
| Mar-24* | 256.0 | 78.9 | 79.3 | 144.3 | 116.6 | 215.7 | 219.4 | 203.0 | 173.3 |
*Provisional
Growth Rates (on Y-o-Y basis in per cent)
| Sector | Coal | Crude Oil | Natural Gas | Refinery Products | Fertilizers | Steel | Cement | Electricity | Overall Growth |
| Weight | 10.33 | 8.98 | 6.88 | 28.04 | 2.63 | 17.92 | 5.37 | 19.85 | 100.00 |
| Mar-23 | 11.7 | -2.8 | 2.7 | 1.5 | 9.7 | 12.1 | -0.2 | -1.6 | 4.2 |
| Apr-23 | 9.1 | -3.5 | -2.9 | -1.5 | 23.5 | 16.6 | 12.4 | -1.1 | 4.6 |
| May-23 | 7.2 | -1.9 | -0.3 | 2.8 | 9.7 | 12.0 | 15.9 | 0.8 | 5.2 |
| Jun-23 | 9.8 | -0.6 | 3.5 | 4.6 | 3.4 | 21.3 | 9.9 | 4.2 | 8.4 |
| Jul-23 | 14.9 | 2.1 | 8.9 | 3.6 | 3.3 | 14.9 | 6.9 | 8.0 | 8.5 |
| Aug-23 | 17.9 | 2.1 | 9.9 | 9.5 | 1.8 | 16.3 | 19.7 | 15.3 | 13.4 |
| Sep-23 | 16.0 | -0.4 | 6.6 | 5.5 | 4.2 | 14.8 | 4.7 | 9.9 | 9.4 |
| Oct-23 | 18.4 | 1.3 | 9.9 | 4.2 | 5.3 | 13.6 | 17.0 | 20.3 | 12.7 |
| Nov-23 | 10.9 | -0.4 | 7.6 | 12.4 | 3.4 | 9.8 | -4.8 | 5.7 | 7.9 |
| Dec-23 | 10.8 | -1.0 | 6.6 | 4.0 | 5.8 | 8.3 | 3.8 | 1.2 | 5.0 |
| Jan-24 | 10.2 | 0.7 | 5.5 | -4.3 | -0.6 | 8.7 | 5.7 | 5.7 | 4.1 |
| Feb-24 | 11.6 | 7.9 | 11.3 | 2.6 | -9.5 | 9.1 | 9.1 | 7.5 | 7.1 |
| Mar-24 | 8.7 | 2.0 | 6.3 | -0.3 | -1.3 | 5.5 | 10.6 | 8.0 | 5.2 |
*Provisional.
Y-o-Y is calculated over the corresponding financial year of previous year
 15 Nov 2023
Public Holidays in the State of Maharashtra for 2024
Maharashtra Government notifies public holidays for 2024 under the Negotiable Instruments Act
Copy of Notification attached
Business leaders call for transformative policies at COP28 to accelerate decarbonisation
More than 100 senior executives from the Alliance of CEO Climate Leaders, the world’s largest CEO-led community committed to net zero emissions, signed an open letter recently ahead of the COP28 climate conference, calling on leaders from the public and private sectors to accelerate net-zero actions to reduce carbon emissions for the benefit of society, public health and the global economy.
The latest IPCC report has confirmed that the world is on course to breach the critical barrier of 1.5°C warming within the next two decades, setting a path to cascading climate tipping points and irreversible damage to the Earth’s planetary systems. Limiting the average global temperature increase to 1.5°C would require 50% emissions reductions by 2030 – amounting to annual emission reductions greater than what was achieved during the COVID-19 pandemic.
India poised to be world’s third largest economy by 2030: S&P Global Market Intelligence
According to the latest report from S&P Global Market Intelligence, India is poised to become the world’s third-largest economy, surpassing Japan by 2030. The report anticipates that India’s GDP will double, reaching $7.3 trillion, up from $3.5 trillion in 2022. This rapid economic growth will lead to India overtaking Japan as the second-largest economy in the Asia-Pacific region. Currently, Japan holds the third position globally, following the United States and China.
The substantial increase in foreign direct investment into India over the past decade reflects the promising long-term growth prospects of the Indian economy. This growth is driven by a youthful demographic profile and rapidly rising urban household incomes. By 2022, India’s GDP had already exceeded that of the United Kingdom and France. The report also predicts that by 2030, India’s GDP will surpass Germany’s.
Notably, Japan is expected to slip to the fourth position in the world economy rankings based on US dollar valuation, as Germany takes over the third spot. The International Monetary Fund’s projections support this change.
India stands out as an outperformer in the emerging market landscape, with the private sector experiencing the second-fastest sales growth in over 13 years, contributing to overall economic expansion. While Russia reported robust growth, mainland China’s expansion slowed, and Brazil faced economic contraction during the survey period, as highlighted by S&P.
The report also underscores the global economic slowdown, which reached its lowest point in eight months by the end of the third quarter. Furthermore, the first contraction in global new orders and a significant decrease in work backlogs suggest potential weaknesses in the coming months.
RBI mandates private banks to have atleast 2 whole time directors
The RBI has instructed banks to ensure the presence of at least two Whole Time Directors (WTDs), including the MD & CEO, on the boards of banks. As per the RBI, the number of WTDs shall be decided by the Board of the bank by taking into account factors such as the size of operations, business complexity, and other relevant aspects.
Further, RBI has said that banks lacking two executives in directorial roles must present proposals for the appointment within a four-month timeframe. “Given the growing complexity of the banking sector, it becomes imperative to establish an effective senior management team in the banks to navigate ongoing and emerging challenges. Establishment of such a team may also facilitate succession planning, especially in the background of the regulatory stipulations in respect of tenure and upper age limit for Managing Director and Chief Executive Officer (MD & CEO) positions,” the RBI has said in a statement.
DPIIT-Registered Startups Exempt from Angel Tax Amendment Provisions of Budget 23
Startups registered with DPIIT will not be subject to assessment proceedings relating to Angel Tax amendments made in Budget 2023.
The Income Tax Department had last month notified new angel tax rules for evaluating the shares issued by unlisted startups to investors.
While previously the angel tax – a tax levied on capital received on the sale of shares of a startup above the fair market value – was applicable only to local investors, the Budget for the 2023-24 fiscal (April 2023 to March 2024) widened its ambit to include foreign investments.
As per the Budget, the excess premium will be considered as ‘income from sources’ and taxed at the rate of up to over 30 per cent. However, startups registered by the DPIIT were exempt from the new norms.
September WPI at -0.26%, in Negative for Sixth Month
India’s Wholesale Price Index (WPI) reported a provisional annual deflation of 0.26% in September 2023, marking a decline from the previous month’s rate of -0.52% in August 2023. The decline in prices was attributed to decreases in chemical and chemical products, mineral oils, textiles, basic metals, and food products compared to the corresponding month of the previous year.
The WPI and inflation rates for all commodities and major groups for the past three months are:
All Commodities (Weight: 100.0%): The WPI decreased from 152.4 in August 2023 to 151.5 in September 2023, with a corresponding drop in the annual inflation rate from -0.52% to -0.26%.
Primary Articles (Weight: 22.62%): The WPI decreased to 182.4 in September 2023, showing an annual inflation rate of 3.70%, compared to 189.6 and 6.34% in August 2023.
Fuel & Power (Weight: 13.15%): The WPI increased to 153.1 in September 2023, resulting in an annual inflation rate of -3.35%, compared to 149.6 and -6.03% in August 2023.
Manufactured Products (Weight: 64.23%): The WPI increased to 140.3 in September 2023, with an annual inflation rate of -1.34%, compared to 139.8 and -2.37% in August 2023.
Food Index (Weight: 24.38%): The WPI declined to 177.8 in September 2023, showing an annual inflation rate of 1.54%, compared to 186.1 and 5.62% in August 2023.


It is a long established fact that a reader will be distracted by the readable content of a page when lookin


